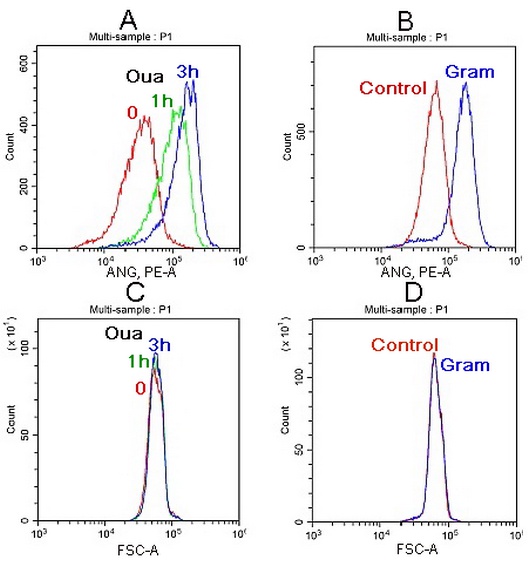
Fig. 4. ANG fluorescence (A, B) and FSC-histograms (C, D) for the ouabain- and gramicidin-treated cells. Histograms were obtained in independent representative experiments with the same instrument settings for the compared data. Cells were treated with 10 µM ouabain for the indicated time; 5 µM gramicidin was added for 30 min with ANG-AM.